


November 30, 2020
Topics
Taking decisive action now can ensure that we remain on track to meet state climate goals and most importantly that we protect the safety and well-being of people across the state. Download The Road to Cleaner Air PDF here.
The Road to Cleaner Air
Improvements for sustainable transportation
Cleaning Up How We Get from Here to There
Transportation is a leading source of greenhouse gas and smog-forming NOx emissions in California. To make significant reductions in vehicle-related pollution, we need a comprehensive approach to increase access to clean transportation mobility, connectivity and safety.
That framework requires a significant shift away from dependence on single-occupancy and combustion motor vehicles, an ongoing challenge for California communities as they work to reduce emissions, improve health and equity, and respond to the COVID-19 pandemic, wildfires and other climate impacts now and in the future.
In California, mobile sources are the largest contributor to NOx and GHG emissions. In 2017, direct emissions from mobile sources were responsible for 80% of statewide NOx and 40% of statewide GHG emissions.
– Draft 2020 CARB Mobile Source Strategy
Health Impacts from Transportation Emissions
In addition to NOx emissions that lead to ozone pollution, combustion vehicles are also a source of particulate matter. Both ozone and particle pollution can increase the risk of premature death and other serious effects such as asthma attacks, lost work days and cardiovascular damage, as well as developmental and reproductive harm. Particle pollution can also cause lung cancer, and new research links air pollution to the development of serious diseases, such as dementia, according to the American Lung Association.
Children, seniors and people living with respiratory, cardiovascular and other chronic health conditions are more vulnerable to poor air quality.
A nationwide study from Harvard’s T.H.Chan School of Public Health found that people with COVID-19 who live in regions with high levels of air pollution are more likely to die from the disease than people who live in less polluted areas, and that a small increase in long-term exposure to fine particulate matter leads to a large increase in the COVID-19 death rate. Both COVID-19 and air pollution also make a disproportionate impact on disadvantaged communities and people of color in California.
The American Lung Association’s 2020 “State of the Air” report found that more than 38 million California residents live in counties where ozone or particle pollution placed their health at risk. The state still includes many of the most ozone-polluted cities in the United States and, while improvements continue, several cities experienced increased unhealthy ozone days in the latest assessment.
In this year’s report, the three most ozone-polluted cities in the United States – Los Angeles,Visalia and Bakersfield – each suffered more unhealthy days of high ozone than they did in the 2019 report. Five California cities are also on the nation’s top-10 list for most impacted by unhealthy particle- pollution days, with many California cities experiencing greater particle-pollution burdens due to historic wildfires.
Hotter temperatures, brought on by GHG emissions that cause climate change, are making ozone more likely to form and harder to clean up, and are also contributing to the greater frequency and magnitude of wildfires and associated particle-pollution impacts.

Growth in Vehicle Miles Traveled
“Transportation emissions are increasing and we must understand what Californians need to help reverse that trend. This is critical since all signs indicate climate change is happening faster than expected.”
– Mary Nichols, Chair, California Air Resources Board
The California Air Resources Board’s Draft 2020 Mobile Source Strategy notes,“before the COVID-19 pandemic, Californians were continuing to drive more, and carpool less to work. Auto ownership was increasing and transit ridership was falling across California, and there continues to be a relatively small percentage of people that walk and bike to work.”
Between 2001 and 2017, the number of vehicle miles traveled (VMT) grew by nearly 14%, about the same rate as population growth during this period.
The consequences: Rising VMT means continued high household travel costs, a greater risk of traffic crashes and fatalities, higher fuel consumption and worsening air quality, more congestion and delay, and more wear and tear on roads and highways, as detailed in the Public Review Draft of the California Transportation Plan (August 2020).
Indeed, more Americans have died in car crashes since 2000 than did in both World Wars. There was an 8% increase in fatalities from 2009-18, with between 30,000 and 40,000 people killed each year. Pedestrian deaths comprised 17% of the total traffic fatalities, an alarming 53% increase during the period.
Preliminary estimates reported by the Governors Highway Safety Association for the first half of 2019 show California led the country in pedestrian fatalities, with the eighth-highest crash rate for the six-month period.
VMT is expected to continue to increase by 13% between 2015 and 2050 under State Department of Finance population forecasts, and by as much as 35% based on growth forecasted by California metropolitan planning organizations. Much of the growth will occur in the Bay Area and Los Angeles regions, with the San Joaquin Valley, the Sacramento region and the Inland Empire also experiencing a significant increase due to high population-growth estimates, and relatively fewer non-auto options, according to the Public Review Draft of the California Transportation Plan.
During the pandemic: Mobility in California dropped dramatically after shelter-in-place orders were enacted early in the pandemic, with a 50-60% reduction in light-duty vehicle (cars, small vans and trucks) miles traveled from early- to mid-April.
Numerous studies and media accounts reported notable reductions in pollution levels and passenger-vehicle traffic, along with increases in walking and bicycling – underscoring how changes in the way Californians travel can affect air quality and congestion.
The cleaner skies have shown how quickly pollution can be brought down with the reduction of vehicle miles traveled and burning of fossil fuels. But these improvements are temporary and stay-at-home mandates are not the solution. Achieving healthier air long-term will require major policy changes and infrastructure investments to shift to clean energy and transportation.
Policy action: California has adopted state policies to support transition away from an overreliance on single-occupancy travel to meet transportation needs. With the passage of SB 375, metropolitan planning organizations (MPOs) are responsible for aligning land-use and transportation planning to reduce emissions. The California Air Resources Board has also established emissions reduction targets that MPOs must strive to achieve through their Regional Transportation Plan/Sustainable Communities Strategies.
Statewide, current MPO Sustainable Communities Strategies are planning for a 9.6% reduction in per-capita passenger-vehicle CO2 emissions by2020 and an 18% reduction by 2035 compared to 2005 levels. This exceeds the limit CARB set in 2010, and is less aggressive than the reductions needed to meet CARB’s draft 2020 Mobile Source Strategy scenario targets. This evidence shows that California is clearly not on the trajectory to reach SB 375 climate goals.
Sustainable Transportation Choices
To reduce VMT and emissions from passenger vehicles, particularly single occupancy vehicle trips, cities will need to facilitate drastic mode shifts to achieve widespread adoption of clean-mobility options. The order of mobility strategies should prioritize the largest focus on (1) active transportation as the healthiest and most sustainable option, on (2) transit and pooled shared mobility for longer trips, and finally on (3) zero-emission vehicles (ZEVs) for trips where transit or active transportation is not a viable option (depicted in the modal hierarchy to the right).
Social equity must be prioritized to ensure that all communities can access clean-mobility options. Outreach, education, incentives and engagement are needed to help shift behavior and cultural norms.
Private-vehicle ownership is the second-largest expenditure for Americans on an annual basis. When considering costs related to vehicle purchases, registration, insurance, fuel and maintenance, owning a car can be a significant financial burden, particularly for low-income individuals who lack access to other mobility options.
To achieve shifts in the types of methods used for travel, local governments will need to partner with agencies and organizations throughout their regions to create a strategic mix of incentives for clean-mobility options and disincentives for internal-combustion-engine vehicles.
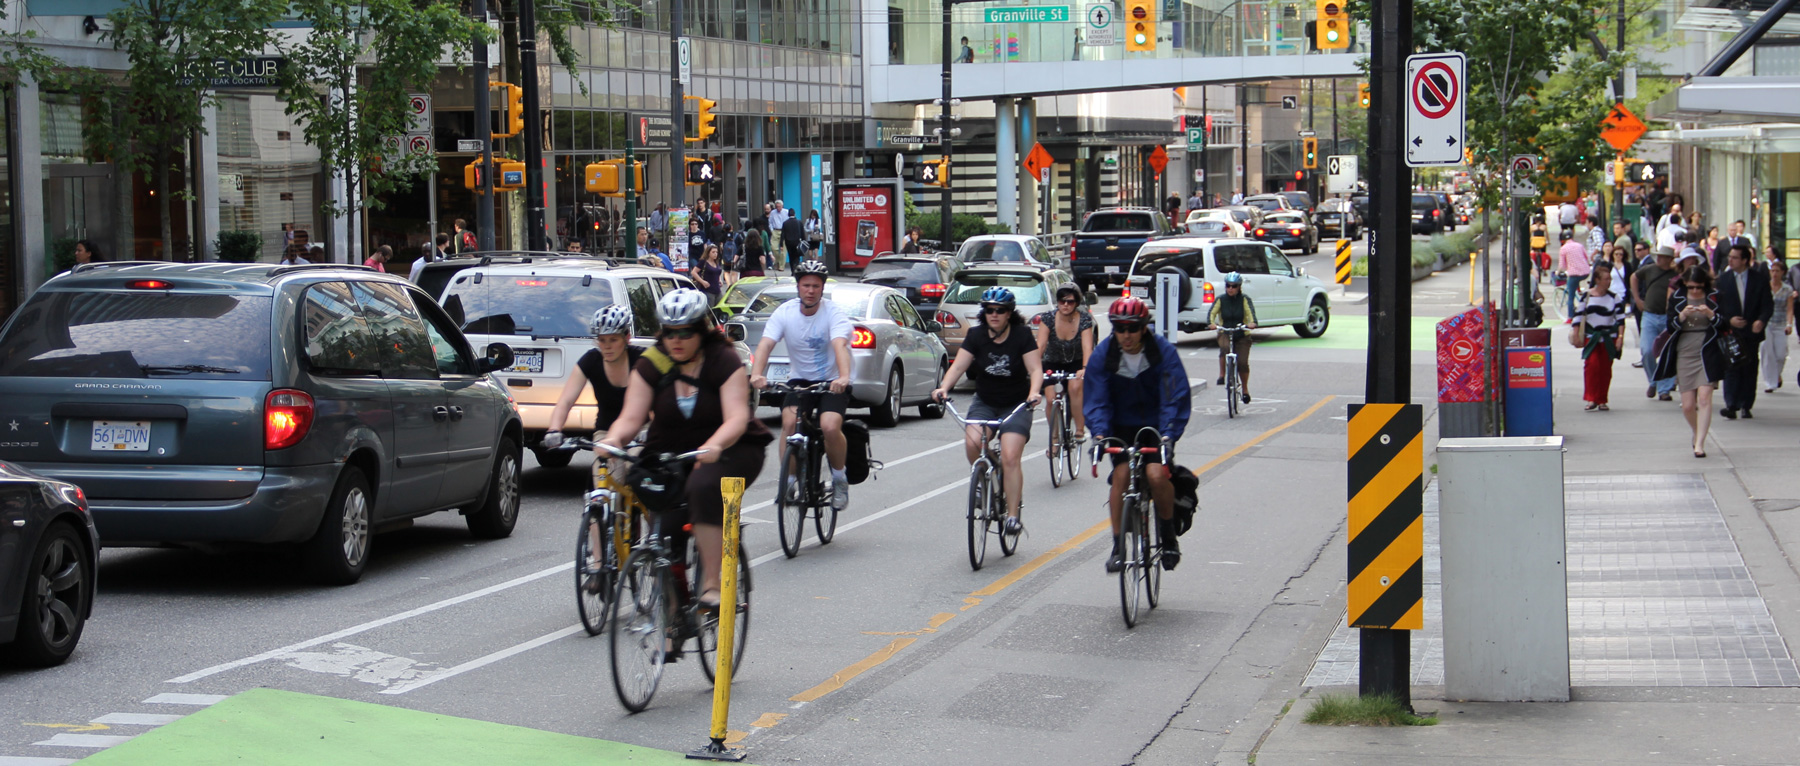
Active Transportation
Through pedestrian-focused design and improvements to walking and bicycling infrastructure, local governments can create a safe, attractive environment that promotes active transportation and reduces vehicle use, traffic congestion and air pollution.
Active transportation can also provide important benefits from improved health, as a result of regular physical activity, and from cost savings for residents.
Providing adequate active-transportation infrastructure directly benefits marginalized communities, particularly lower-income communities that rely on walking and biking to meet their basic needs. Studies have shown that families with annual incomes between $10,000-25,000 have higher rates of using active-transportation methods. However, lower-income residents, are twice as likely to be killed while walking to their destinations compared to higher-income residents, as reported in the Safe Routes toSchool National Partnership’s “Fighting for Equitable Transportation: Why It Matters.”
Local governments should approach transportation projects from the perspective of non-motorists by informing and prioritizing projects based on an integrated set of safety, accessibility, connectivity and walkability criteria:
- Safety: Install traffic calming, sidewalk, bikeway and crosswalk improvements along high-speed, high-traffic-volume streets and complete-street projects that improve safe travel to schools and other public facilities.
- Accessibility: Establish universally accessible, ADA-compliant pedestrian routes and prioritize locations that currently lack pedestrian infrastructure to serve people of all ages and abilities.
- Connectivity: Create a seamless and continuous low-stress network of pedestrian and bike routes by eliminating gaps and prioritizing connections to public facilities and commercial hubs.
- Walkability: Improve site amenities such as shade, lighting and places to sit; protection from traffic and inclement weather; and create more slow or limited-vehicle-access streets to provide added space for people walking and bicycling.
The potential of reducing emissions by increasing active transportation is undeniable. The 2017 National Household Transportation Survey found that 21.4% of all vehicle trips were one mile or less.
Studies show up to 46% of adults are willing to walk to church or school, 40% to stores, and 35% to work when trips are within one mile. Active-transportation-first policies and investments can significantly reduce VMT, particularly for shorter trips that can be easily completed through active-transportation modes.
The COVID-19 health crisis has accelerated the use of active transportation. A recent UC Davis Institute of Transportation Studies survey found that the number of people who walk every day increased from 10% prior to the pandemic to 16% during the pandemic. UC Davis’Susan Handy reports a resurgence in bicycling with the onset of the pandemic.
“They’re buying bikes like toilet paper,”an industry expert was quoted early in the pandemic.
Cities across the U.S.and throughout the world have been repurposing their street and sidewalk spaces to provide a safer, more appealing walking and bicycling environment and support outdoor eating and exterior commerce.
Investing in pedestrian infrastructure can also generate multiple benefits for communities and local economies. For example, a 2012 study by the Vermont Agency of Transportation found that bicycling and walking in its state created at least 1,400 jobs, $41 million in wages and $83 million in revenue from active-transportation-related businesses and events.
By making active transportation safe and convenient, cities can create dynamic, connected communities that support local businesses and foster economic health. Enhanced connectivity between neighborhoods and commercial hubs can increase foot traffic and enable businesses toengage new customers, which is particularly important for smaller businesses that may not have a robust online presence.
Improved pedestrian and bicycle infrastructure can also make transit a more viable and convenient option for riders by providing “first and last mile”connections to stops and stations.
Transit and Shared Mobility
To achieve clean air and net-zero carbon emissions, transit must be at the center of a robust multimodal transportation network. Particularly for longer trips where active transportation may not be feasible, transit and shared-mobility options should be prioritized.
A Brookings Institute analysis of 2016 census data revealed that about 76% of working Americans commute in single-passenger vehicles, while only 15% use transit or other shared modes of travel.
By creating a robust multimodal network centered around electrified transit, cities can effectively reduce transportation-related emissions by shifting users away from single-occupancy vehicle trips. The rapid evolution of the transportation sector in recent years has brought online numerous shared-mobility services – from bike and scooter shares to ride-sharing and ride-hailing services.
Looking beyond traditional public transportation, cities and counties can leverage micro-transit and shared-mobility services to encourage residents to use multiple clean-mobility options to meet their travel demands. Commuting by transit has proven to be one of the most significant actions to
reduce household carbon emissions, and widespread adoption would generate even deeper reductions. In addition to saving 4,800 pounds of carbon emissions per year, taking transit to work can save a two-worker household more than $6,000 annually, according to the American Public Transportation Association.
Transit electrification will produce further emission reductions. California’s Innovative Clean Transit regulation approved by the Air Resources Board set a statewide goal for public transit agencies to transition to an all zero-emission bus fleet by 2040. This is expected to reduce GHG emissions by19 million metric tons from 2020 to 2050 – the equivalent of taking four million cars off the road. Through this regulation, California’s public transit agencies will continue to play a pivotal role in meeting the state’s air quality and climate goals.
The onset of COVID-19 and physical distancing hit public transit hard, due to concern that trains and buses posed a virus-transmission threat. A report released in September 2020 on behalf of the American Public Transportation Association, however, found no direct correlation between urban transit use and the transmission of infectious disease. An analysis of transit ridership in multiple cities also showed no correlation with the rise or fall of local COVID-19 cases.
The study further highlights the long-term health consequences of people switching in large numbers from public transit to private cars: “On a per mile basis, passengers are about 20 times more likely to experience a fatal crash in a car than when using public transit. In addition, more time spent in a car can also lead to inactivity diseases, including obesity, diabetes, and high blood pressure. On an environmental basis, cars pollute far more than public transit and increase a traveler’s carbon footprint.”
Finally, the report provides a compendium of practices for “transit agencies to keep workers and riders safe, from mandating masks and adjusting service to rider communications and data technology.”
Zero-Emission Vehicles
For longer trips where transit or active transportation is not a viable option, electrification of personal vehicles will be a critical strategy for reducing pollution.
The newly released “Road to Clean Air”report by the American Lung Association finds that nationwide transition to zero-emission transportation could reduce emissions by 2050, saving $72 billion in avoided health costs, approximately 6,300 lives, and avoiding more than 93,000 asthma attacks and 416,000 lost work days annually.
In California, the avoided health impact cost would exceed $22 billion annually with over 1,900 fewer premature deaths, 22,000 fewer asthma attacks and 122,000 sick days from work.
The report also estimates benefits from avoided climate-change impacts could surpass $113 billion nationwide as vehicles combust far less fuel and our power system comes to rely on cleaner, non-combustion renewable energy.
Ambitious ZEV goals: The combination of state emission standards, California’s goals set by Governor Brown for 5 million ZEVs on the road by 2030, and 250,000 electric-vehicle charging stations installed by2025 puts the state on a trajectory toward cleaner cars and cleaner air. As all of California continues to suffer from climate-exacerbated heat waves and wildfires, Governor Newsom followed with another ambitious step in the state’s efforts to address climate change, issuing an executive order mandating new cars to be zero-emission by 2035.
Since 2011 (over an eight-year time period), Californians have bought 726,000 electric cars, with 156,000 in 2019 sales of zero-emission vehicles (less than 10% of new car sales). Seven-fold growth is required over the next 10 years to reach 5 million ZEVs by 2030.
Governor Newsom’s order could help California more rapidly ramp up electric-vehicle production and sales, help dramatically improve air quality, and reduce greenhouse gas emissions (by 35%, according to the governor’s office).
Nevertheless, 15 years is a very short time frame to achieve the statewide goals. State and local governments will need to ramp up efforts – ranging from updating policies to increasing charging infrastructure – to plan for electric vehicles.
How to get ready
The California Plug-In Electric Vehicle Collaborative’s “Toolkit for Community Plug-In Electric Vehicle Readiness” offers a number of practical strategies to increase community readiness:
- Update zoning and parking policies to address signage, charger installation that incorporates accessibility guidelines, and parking-space requirements.
- Update local building codes to include specifications for charging infrastructure types, electric-service requirements and installation recommendations for various building types.
- Streamline permitting and inspection to make installing a charger easy through online applications, same-day “over-the-counter”approvals and minimal fees.
- Participate in training and education programs for local officials to increase familiarity with charging infrastructure for inspection and maintenance and better understand the safety implications of vehicles and chargers.
- Conduct outreach and education to local businesses and residents on permitting, local contractors, incentives and locations of charging stations.
- Increase charging opportunities for residents in multi-family housing, including reaching out to local homeowners’ associations to work through their concerns and building challenges and exploring opportunities such as identifying nearby public or workplace charging that tenants can access during non-business hours.
- Encourage local employers to install workplace charging by informing local employers and property owners of the benefits of providing workplace charging (to employees), and how to implement it.
- Include electric vehicles in local fleets by setting a target for the number of PEVs, establishing purchase and evaluation criteria, and co-locating fleet-charging stations with public-access stations for shared use.
Clean-Mobility Policies
New state clean-mobility policies are helping to advance the transition to clean-transportation technologies and reduced VMT.
To further California’s climate goals, Governor Newsom’s 2019 Executive Order N-19-19 directs the California State Transportation Agency (CalSTA) to leverage its annual portfolio of $5 billion to reduce transportation fuel consumption and GHG emissions and align transportation spending, programs and mitigation with State climate goals.
CalSTA is developing an Action Plan, with implementation beginning in early 2021. It will chart a path toward the goals and recommendations in the draft California Transportation Plan 2050, with investments that promote projects that reduce reliance on passenger vehicle travel; reduce harmful emissions, health and safety impacts; and support development of a safe, accessible bicycle and pedestrian infrastructure and integrated statewide rail and transit network.
The executive order also directs the California Air Resources Board (CARB) to push automakers to produce cleaner vehicles, and find ways for more Californians to purchase these vehicles on the new and used markets. CARB is tasked with developing new grant criteria for clean-vehicle programs to encourage manufacturers to produce clean, affordable cars and propose new strategies that increase demand in the primary and secondary markets for zero-emission vehicles.
State Senate Bill 44, signed in 2019, requires CARB to update California’s Mobile Source Strategy (MSS) every five years, with the 2020 MSS update slated for March 2021. The actions included there will support much-needed efforts to modernize and upgrade the transportation infrastructure, enhance systemwide efficiency and mobility options, and promote clean economic growth in all of the major mobile sectors.
The working draft of the 2020 MSS notes that the light-duty vehicle sector will need to make strong contributions toward regional and statewide emission targets, as well as 2030 and 2050 climate goals. Meeting these thresholds will require pushing toward a 25% reduction in light-duty fleet VMT below 2005 levels by 2035, in addition to moving the state toward 100% of sales as electric vehicles.
SB 743, adopted in 2013 to update California Environmental Quality Act Guidelines (CEQA), takes into account VMT generated by proposed new development. Those changes went into effect July 1, 2020. Agencies analyzing new projects may now look at how much actual auto travel (additional miles driven) would be created instead of the level of service (traffic delays for motorists), which has discouraged infill and resulted in costly road expansion and sprawling development – ironically making it harder for residents to reach their daily destinations without driving long distances.
The Path Ahead
Meeting California’s increasingly ambitious climate goals will require significant emissions reductions from transportation sources. Electrification is one critical part of the solution, but reducing infrastructure costs, congestion and the degradation of natural resources will require a more holistic approach that includes policies and investments to advance active transportation and transit. These strategies align with an unmet market demand for walkable, connected communities and will help maximize public health benefits (beyond the air-quality-related benefits of electric vehicles).
“While positive gains have been made to improve the alignment of transportation, land use, and housing policies with state goals, the data suggest that more and accelerated action is critical for public health, equity, economic, and climate success,” the California Air Resources Board reports. “California will not achieve the necessary greenhouse gas emissions reductions to meet mandates for 2030 and beyond without significant changes to how communities and transportation systems are planned, funded, and built.”
Taking decisive action now can ensure that we remain on track to meet state climate goals and most importantly that we protect the safety and well-being of people across the state.